The Problem
Most beauty and supplement founders in the €500K–5M range aren’t short on data. Their ad platform gives them CAC. Their Shopify dashboard gives them CVR, AOV, repeat rate. Their finance sheet gives them a P&L.
What they don’t have is a diagnosis.



Founders at this stage ask us some version of the same three questions almost every week:
- “Why is my CAC rising / my CVR falling, and I don’t know why?”
- “Which SKU should actually get the budget?”
- “Should I keep optimizing on lower spend, or scale into a lower — but still acceptable — ROAS?”
None of these are data problems. They’re diagnostic problems. The data exists. What’s missing is the framework to read it correctly, and — just as often — the instinct for what to check before reaching for more spend.
Doubling Revenue by Cutting a Beauty Brand’s Traffic in Half (Case Study)
A luxury US beauty brand came to us with a top-of-funnel problem. We took over the Meta ad account on the 1st of July. Thirty days later, link clicks were down 57.5%, conversion rate was up 262%, and Meta-attributed revenue had more than doubled — $87,835 against roughly the same spend.
This gap shows up at every revenue stage, but it hits hardest between €500K and €5M ARR. Below that, most brands survive on one channel and one hero product; the diagnosis barely matters yet.
Above €5M, most brands have hired someone whose whole job is this diagnosis. In between, a founder is usually still making these calls personally, with less time and less specialized help than the problem deserves.
Consider what a recent audit of 40+ eight-figure DTC ad accounts found: one brand had never correctly defined its “new” versus “engaged” audiences, and was unknowingly spending 41% of its budget re-targeting people who’d already bought. That’s not a creative problem or a targeting problem. It’s a definitions problem — invisible until someone actually goes looking for it. If that’s happening at eight figures, with dedicated media buyers on staff, it is close to certain at €500K–5M, where the founder is often reading the dashboard themselves between everything else on their plate.
Evolut insight
We run this diagnosis before every proposal, not after. In 9 out of 10 accounts, we find the same leak: spend going toward customers who’ve already converted.
The instinct at this stage is almost always the same: if growth stalls, push more spend. If a metric looks bad, optimize that one metric. Both instincts skip a step. Rising CAC and falling CVR aren’t single-variable problems — they’re symptoms that trace back to one of a small number of root causes: (1) traffic quality, (2) creative-persona mismatch, (3) an offer that doesn’t hold up past the click, or a genuine shift in the customer you’re acquiring. Optimizing the wrong layer wastes budget optimizing the visible symptom while the actual cause keeps compounding.
Prof. Daniel McCarthy, founder of Theta and professor at the University of Maryland, puts a name to one version of this trap: the customer acquisition treadmill. A brand can look like it’s growing — revenue trending up, dashboards look healthy — while actually just spending more to replace customers who never return. Because overhead doesn’t scale in step with ad spend, the business can even look more profitable for a while, right up until the treadmill stops.
D2C Diares podcast with Prof. Daniel McCarthy
This piece is a framework for getting off the treadmill and onto a diagnosis. Not a general theory of DTC growth — a specific set of questions, in a specific order, that tell you what’s actually broken before you decide whether the answer is “fix it” or “scale it anyway.”
Three things we’ll work through:
- What CAC, LTV, CVR, and the metrics around them are actually telling you, and the correlations that matter more than any single number in isolation.
- Which SKU deserves your budget — a margin-and-retention lens, not a “what’s selling fastest” lens.
- When to optimize on lower spend versus scale into a lower — but sustainable — ROAS — a decision, not a guess.
The Unit Economics That Actually Matter
Before you can decide anything — SKU focus, scale vs. optimize — you need the right numbers, read the right way. Most founders at €500K–5M ARR already track CAC, LTV, CVR, AOV, and repeat rate. Very few of them are reading these numbers in relation to each other. That’s where the real diagnosis lives.
Start with what CLV actually means
Founders often think they’re tracking LTV. Most aren’t. Prof. Daniel McCarthy has audited this exact mistake across hundreds of companies and shared his insights on the D2C Diaries podcast recently:
“We’ll often see people talking about LTV, and you actually ask them for the formula that they’re using. And oftentimes it’s as simple as realised cumulative revenue per customer … And it’s wrong on so many levels.”
Real LTV is a discounted contribution-profit measure: revenue minus every variable cost (materials, shipping, payment processing, expected returns), projected forward, then discounted back to today’s value.
Skip any one of those steps — use revenue instead of profit, forget to discount, use a made-up 90-day cutoff — and the number you’re looking at isn’t LTV. It’s a guess wearing an LTV label.
Why does this matter for a €500K–5M brand specifically? Because at this stage, LTV is usually the input to a bigger decision — how much you can afford to pay for a customer, how aggressively you can bid, whether a new SKU justifies its acquisition cost. A wrong LTV doesn’t just look bad on a slide. It quietly greenlights bad spending decisions for months.
CAC and CVR rarely move for the reason you think
The instinct when CAC rises is to blame the market or the algorithm. Often the real cause is upstream — inside your own account, not the platform.
A recurring pattern across dozens of account audits: brands still running view-through attribution windows (seven-day click, one-day view) that quietly credit conversions that would have happened anyway — inflating perceived efficiency while masking the real acquisition cost.
The diagnostic habit this points to: don’t read CAC or CVR alone. Read them against the metric that would explain them.
- CVR drops, AOV holds steady → look at traffic quality or landing page match before touching the offer.
- CAC rises, CVR holds steady → look at auction competition, attribution windows, or audience-definition leaks before assuming the market got harder.
- LTV stays flat while CAC climbs → you’re not looking at an acquisition problem. You’re looking at a retention problem wearing an acquisition problem’s clothes.

The discount trap
One correlation matters more than founders usually realize: acquiring a customer on a discount doesn’t just cost margin on the first order — it changes who that customer is for their whole lifetime. McCarthy calls this net CAC and net CLV:
“If you acquire a customer on a discount, mechanically it’s going to lower their CLV, because the first purchase is less profitable. Right there, even if they were identical after acquisition… what you often find is that their net CLV, the value after that first purchase, is also lower. So it just brings in a lower quality customer.”
This connects to a pattern we’ve seen across beauty and supplement ad accounts. Some brands sell with a discount (“60% off”). Others sell with a value story (“one product replaces your whole stack”). The discount approach costs more than it looks like. Yes, you lose margin on every sale. But you may also be bringing in worse customers — ones less likely to stick around. It’s a second, invisible cost sitting behind every discount-led acquisition strategy.
The honeymoon phase
One more correlation error worth naming, because it directly misleads founders reading their own cohort tables: new customers often buy unusually often in their first month or two, then settle into a lower baseline. McCarthy again:
“You’ve got these customers that were born two months ago, and their first month was amazing. And you’re like, wow, these cohorts are just getting better and better over time. And it’s actually — no, they’re not getting better. They’re staying the same. They’re just in the honeymoon phase.“
Read a cohort table without accounting for this, and you’ll conclude your newest customers are your best customers — right before they regress to the mean everyone else lands on. That’s a dangerous read to build a scaling decision on.
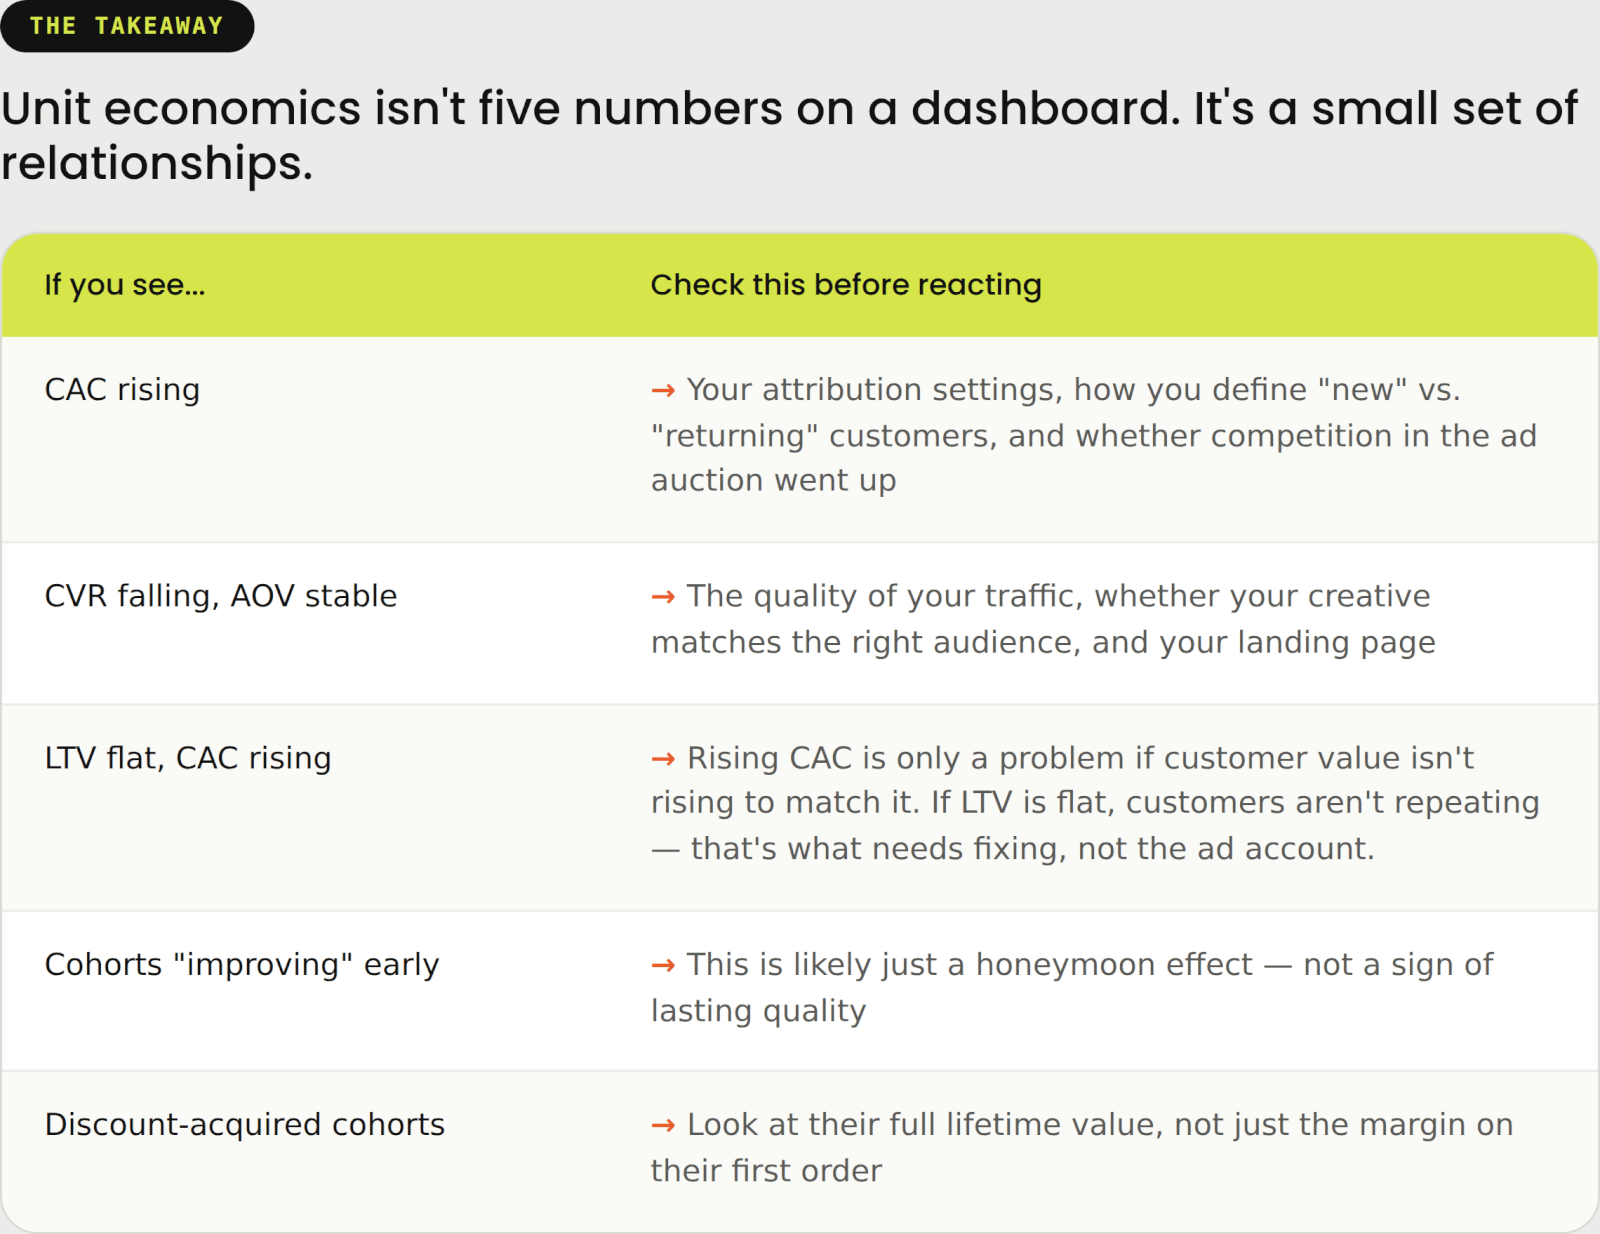
Get this right, and the next two decisions get much easier. Which SKU deserves the budget, and whether to scale or optimize — both stop being guesses. You’ll have the numbers to back up the call.
Which SKU Should Get the Budget
Ask a founder which product to scale, and the answer is almost always instinct: “the one that sells fastest” or “our hero product.” Neither answer accounts for unit economics. A SKU that converts well on the ad but carries thin margin, low repeat rate, or a customer base that churns fast can quietly be the worst thing to scale, even while its top-line numbers look the best in the account.
“Good customers are born, not made, so choose carefully at the point of first purchase”
This is the single most useful reframe from Prof. Daniel McCarthy’s work at Theta. Founders spend enormous effort trying to improve a customer’s value after they’ve already bought — better retention flows, better win-back campaigns, better loyalty perks. McCarthy’s research across hundreds of companies points somewhere else:
“Good customers are born and not made… if you spent a lot of your attention on acquiring the right customers and doing it in the right way, that can often be a lot better than trying to get a whole bunch of customers in the door who potentially could be pretty crappy and somehow try to do a whole bunch of magic to try to make the bad customers into good customers…”
The practical translation for SKU strategy: the product someone buys first predicts more about their long-term value than almost anything you do afterward. If a founder is deciding where to put budget, the question isn’t just “which SKU converts,” it’s “which SKU brings in customers who are inherently the kind that stick.” Some products are entry points for cohorts with real repeat potential. Others attract one-and-done buyers no matter how good the retention flow is.
That means SKU prioritization needs a customer-quality lens, not just a conversion-rate lens.

The three-factor filter: margin, repeat rate, acquisition efficiency
Instead of “which SKU sells fastest,” ask three questions per SKU:
- Margin — after variable costs (materials, shipping, payment processing, expected returns), what’s actually left?
- Repeat rate — of the customers this SKU brings in, what share come back, and how soon?
- Acquisition efficiency — what’s the CAC specifically for this SKU’s funnel, relative to its margin and repeat rate, not the account-wide blended CAC?
A SKU can win on one of these and still be the wrong one to scale. Cheap to acquire but low repeat rate and thin margin is a volume trap. High margin but poor acquisition efficiency means you’re subsidizing every sale with ad spend. The SKU worth scaling is the one that holds up across all three and at €500K–5M ARR, most brands have never actually broken their unit economics down to this level. They have one blended CAC and one blended AOV for the whole account, which hides exactly the signal this decision needs.
Sometimes the answer isn't a SKU, it's a bundle
Carl Weische, whose agency Accelerated took IM8 from pre-revenue to over $50M/month, argues that the SKU question is often the wrong question entirely. The better lever is frequently which combination of SKUs, sold as one offer, rather than any single product on its own.


IM8 offer ads
His example, working with the Spanish haircare brand Coconut Beauty: instead of selling one shampoo, the brand restructured the offer around a four-product routine — shampoo, conditioner, serum, mask — sold together at a discount.
“You have a way higher AOV, the cost don’t drastically increase because you’re already shipping the product. And adding multiple more products to one order, it’s just not going to have that negative impact. So you have a way higher margin.”
This connects directly to the “replace your whole stack” pattern we’ve tracked across supplement ad accounts (IM8, AG1, Grüns): consolidation doesn’t just change how you talk about the product, it changes the math behind it. Shipping cost doesn’t scale linearly with the number of items in a box — so a well-built bundle can lift AOV and margin simultaneously, without the acquisition cost of selling each product separately.
Weische takes the logic one step further with a lever most beauty and supplement brands haven’t touched: adding a non-physical, 100%-margin product to the bundle to increase perceived value and build habit. IM8’s addition of a 90-day transformation programme — a digital, non-shippable add-on — didn’t just raise perceived value. It solved a retention problem.
The digital add-on did double duty: it made the offer feel more valuable without costing anything to produce, and it built the daily habit that kept the subscription alive. Zero marginal cost, direct line to repeat rate — the second of the three factors above.

The IM8 transformational program goes along with the 90 day subscription
When to Optimize, When to Scale
This is the question that actually keeps founders up at night: do I fix the account at current spend, or do I push more budget through and accept a lower — but still workable — ROAS?
Framed as a binary, it’s the wrong question. The right one is: what does my unit economics data say I can afford right now? Scaling and optimizing aren’t opposites. Scaling without the right unit economics underneath it is just a faster way to lose money. Optimizing forever, without ever testing more spend, is how a brand with genuinely strong unit economics stays smaller than it should be.
BTW, what's the right ROAS to look at?
The answer isn’t as obvious as it seems. Almost every brand watches “Purchase ROAS” in Meta, sometimes called “platform ROAS.” The problem: this number also credits purchases from people who only saw the ad, without clicking it. If a Google ad or an email actually convinced them to buy, Meta will still claim the sale as its own.
That inflates the number you’re looking at.
For a more honest read, check two other columns in Ads Manager instead: “7-day click” (which only counts people who actually clicked before buying) and “incremental attribution” (which estimates how many sales wouldn’t have happened without the ad at all). Both sit closer to reality than the default view.
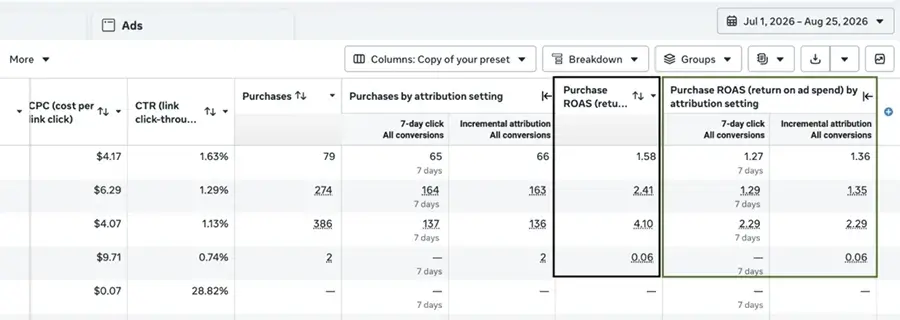
Here’s what that gap looks like in practice. In this account, one ad set shows a Purchase ROAS of 4.10 — the number Meta highlights by default. But look at the same ad set’s “7-day click” and “incremental attribution” columns: 2.29 and 2.29. Almost half.
That’s not a rounding difference. That’s the platform crediting nearly twice as many purchases to itself as the more conservative numbers support. Multiply that gap across your whole ad account, and you can see how easy it is to scale a campaign based on a number that’s flattering you, not informing you.
The warning sign that you're not ready to scale
Prof. Daniel McCarthy’s customer acquisition treadmill is the clearest diagnostic for “don’t scale yet.” Revenue climbing while overhead stays flat can look like healthy growth — right up until it isn’t:
“If you’re throwing enough marketing into customer acquisition, oftentimes you can kind of create or manufacture a lot of growth, but it won’t stick. And you’re kind of stuck on what I would often call the customer acquisition treadmill …”
Here’s the warning sign: CAC climbing while LTV stays flat. If that’s your pattern, more spend won’t grow the business — it just speeds up the treadmill. Fix that first, no matter how tempting the top-line growth looks.
The signal that you're actually ready
The inverse pattern is the green light: CVR holding steady as spend increases, and payback period staying intact even as CAC rises slightly. That combination means the account is absorbing more budget without degrading, which is exactly what “scale into a lower-but-acceptable ROAS” should mean.
Carl Weische‘s work with Accelerated Agency gives this a concrete threshold — though it’s worth noting his clients are typically 8-9 figure brands, so the number needs scaling down. His rule for when a specific angle or persona has earned dedicated investment — a standalone funnel, its own landing page, its own budget line — is spend-based:
“As soon as a certain angle or persona gets a minimum amount of ad budget per month, we are then going to build a standalone or specific landing page or product page. And I would say that number should be somewhere between 50k to 100k per month in ad spend as a threshold, where that makes sense to put in the effort.”
For a brand at €500K–5M ARR, the absolute number isn’t the useful part — the principle is. Scale it down: if one persona or angle is consistently pulling 20-30% of your total monthly ad budget, that’s your equivalent signal. You don’t need Weische’s six-figure threshold to justify a dedicated landing page; you need to see one segment reliably earning a meaningful share of whatever budget you actually have.
IM8's 90-day bet: what "ready to scale" looks like in practice
The clearest real example of testing readiness before scaling comes from IM8’s own trajectory. Weische describes a deliberate, sequenced decision, not a leap:
“They scaled super profitable for like the first 17, 18-ish months. And now they’re at a growth stage where they basically now just want to acquire as much attention, as many customers as possible.”
The permission to shift into aggressive, growth-over-efficiency spending didn’t come first. It came after eighteen months of proving the unit economics held at a profitable pace. Only once that foundation was solid did IM8 make what Weische calls “a huge swing”, moving their front-end offer from a 30-day to a 90-day subscription commitment:
“That offer was a huge swing and a huge bet, but it paid off… it just had a huge, huge impact on customer lifetime value, which then again allowed them to obviously spend more aggressively.”
Notice the sequence: the LTV improvement came first, from the offer change. The permission to scale spend came second, as a consequence. They didn’t scale spend and hope LTV would catch up, they fixed the unit economics lever (subscription length, driving LTV) and let that create the room to spend more aggressively. That’s the whole framework in one case study.
A practical decision rule for €500K–5M brands
You don’t need IM8’s ad spend to apply this logic. The sequence scales down:
- Check the correlation first. Is CAC rising while LTV holds or while LTV also rises? Only the second case supports scaling.
- Check concentration risk. Across dozens of account audits, we keep seeing the same problem: too much spend riding on just one or two ads or funnels. Before you scale, make sure your growth doesn’t depend on a single asset that could stop working tomorrow.
- Look for your own version of the 90-day move. Is there a lever — subscription length, bundle structure, a retention mechanic — that would lift LTV before you add spend, the way IM8’s offer change did? Fixing that lever often creates more room to scale than the spend increase itself would.
- Only then decide the ROAS trade-off. If steps 1–3 hold up, a lower ROAS at higher volume is a reasonable, deliberate trade — not a hope.
Some founders get this backwards: they increase spend first and hope the numbers justify it later. The founders who grow successfully do the opposite. They fix the unit economics first, then scale once the data supports it.
When to Optimize on Lower Spend vs. Scale Into a Lower-but-Acceptable ROAS
Do I fix the account at current spend, or do I push more budget through and accept a lower — but still workable — ROAS?
Framed as a binary, it’s the wrong question. The right one is: what does my unit economics data say I can afford right now? Scaling and optimizing aren’t opposites. Scaling without the right unit economics underneath it is just a faster way to lose money. Optimizing forever, without ever testing more spend, is how a brand with genuinely strong unit economics stays smaller than it should be.
Reframe ROAS-at-scale as a trade-off, not a failure
A lower ROAS at higher spend isn’t automatically a problem. Most media buyers treat any ROAS decline as a red flag — pull back, tighten targeting, protect the ratio. But ROAS is a ratio, and ratios can decline for two very different reasons: because something broke, or because you’re intentionally buying more volume at a slightly higher cost per unit. Only one of those is worth reacting to.
The trade-off is legitimate when the volume you’re buying is still profitable in absolute terms — even if less efficient in relative terms. A campaign running at 4x ROAS on €10K of spend and one running at 3x ROAS on €40K of spend can generate very different total profit, and the second one is very often the better business decision, even though it looks worse on the dashboard. The mistake isn’t scaling into a lower ROAS. The mistake is doing it without checking whether the economics underneath still hold.
The ratio that tells you whether you have room
Before deciding anything, look at your CAC-to-LTV ratio. This is the single number that tells you how much margin for error you actually have.
If LTV comfortably exceeds CAC — say, by a factor of 3 or more — a modest ROAS dip while scaling is just the cost of buying additional volume. You have room. The math still works even if the ratio compresses slightly as you spend more. If your CAC-to-LTV ratio is already tight — LTV only marginally above CAC, or worse, converging toward 1:1 — that same ROAS dip isn’t a trade-off anymore. It’s the account telling you it can’t absorb more spend without becoming unprofitable. Scaling from that starting point doesn’t buy you growth. It buys you a faster route to a worse balance sheet.
This is why an accurate LTV matters so much — you can’t make this decision correctly without one. A brand using undiscounted cumulative revenue as its LTV number will systematically overestimate how much room it has to scale — right up until the account tells them otherwise, the hard way.
Two signals, two directions
Once you know your ratio has room, the account itself will tell you which way to move, if you know what to look for.
Ready to scale looks like:



That combination means the account is absorbing more budget without degrading. You’re not chasing growth that won’t stick, you’re trading some efficiency for volume, deliberately, with the unit economics still supporting the trade.
Fix first looks like the mirror image:


Same starting symptom as the first case — CAC going up — but a completely different diagnosis. This is the pattern Prof. Daniel McCarthy calls the customer acquisition treadmill:
The danger of the treadmill is that it doesn’t announce itself. Revenue can keep climbing for months while overhead stays flat, which makes the business look healthier than it is — right up until the point where new customers stop covering their own acquisition cost, and the whole structure needs more and more fuel just to stand still.
The practical rule: don’t scale on a rising-CAC signal alone. Scale on a rising-CAC-with-stable-CVR-and-intact-payback signal. The first is ambiguous. The second is a green light.
Where most €500K–5M brands get this backwards
The pattern we see most often at this revenue stage is the order of operations getting reversed. A founder sets a revenue target for the quarter or the year, then pushes spend to try to hit it, and only checks the unit economics afterward — usually when the numbers have already started to slip.
That’s backwards. The revenue target should be the output of what the unit economics can support, not the input that spend gets forced to justify. A brand with a 4:1 LTV:CAC ratio and stable CVR at higher spend has genuinely earned the right to set an aggressive growth target. A brand with a 1.5:1 ratio hasn’t — no matter what the board deck or the annual plan says the number needs to be.
This is also where the SKU and offer work pays off directly. A brand that fixes its LTV first — through a better bundle, a stronger subscription structure, a habit-building add-on — creates room to scale that wasn’t there before. Fixing the economics is often a faster route to sustainable growth than pushing spend and hoping the economics catch up.
A Practical Audit Checklist
Before you touch spend, offer, or SKU mix, run your account through these questions. You don’t need new data or new tools — everything here comes from numbers already sitting in your ad account and your Shopify dashboard. Ten minutes with a spreadsheet is enough to answer most of them.
Unit economics
- Is your LTV actually LTV? Check the formula. If it’s cumulative revenue per customer with no discounting and no cost subtraction, you don’t have an LTV number — you have a bigger, more dangerous guess.
- Are you reading CAC and CVR together, or separately? Pull last month’s numbers side by side. If CAC rose, check whether CVR moved too, and in which direction, before deciding what caused it.
- Are your newest cohorts genuinely better, or are you looking at a honeymoon effect? Compare month-one behavior for your last three cohorts against their month-three behavior. If the gap is large, you’re watching early enthusiasm settle, not quality improving.
- Do you know your net CLV on discount-acquired customers, separate from full-price customers? If discounting is a regular acquisition lever, this is the number that tells you what it’s actually costing you long-term.
SKU and offer
- Do you have margin, repeat rate, and acquisition efficiency broken out per SKU — or one blended number for the whole account? If it’s blended, you can’t yet answer which product deserves the budget.
- Is there a natural bundle sitting in your existing catalog that would raise AOV without a proportional increase in shipping or acquisition cost?
- Is there a zero-cost or low-cost addition — a program, a piece of content, a habit-building mechanic — that would extend repeat rate on your best-performing SKU, the way a digital add-on extended IM8’s subscription life?
Scale vs. optimize
- What’s your current CAC-to-LTV ratio, and does it have room? If it’s near 1:1, that’s your answer before you look at anything else.
- Is CVR holding steady as spend increases, with payback period intact — or degrading as spend rises? This single check tells you which of the two signals in Chapter 5 you’re looking at.
- Is more than 20% of your spend concentrated in a single ad, funnel, or asset? If so, your current performance may be more fragile than it looks, regardless of what the ratio says.
- Did you set your growth target before or after checking the ratio? If the target came first, the plan is built backwards — even if the target itself is reasonable.
Close
Every framework in this piece traces back to the same starting point: diagnose before you spend. Not because spend is the enemy — it’s the whole point of running paid media — but because spend without a diagnosis just accelerates whatever direction the account was already heading, good or bad.
None of this is theoretical. It’s built on patterns we’ve verified across our own research — the 500-ad Supplement Marketing 2026 study, live competitor ad data across dozens of beauty and supplement accounts — combined with the on-the-record thinking of people who’ve run this playbook at scale: Prof. Daniel McCarthy’s work across hundreds of companies at Theta and Carl Weische’s work taking IM8 from pre-revenue to $50M+ a month.
The brands that scale well at €500K–5M aren’t the ones with the biggest budgets. They’re the ones who know which number is actually broken before they touch it.
If you’ve worked through the checklist and most of the answers came easily, you likely already know whether you’re ready to scale. If more than half of them stalled you, that gap is worth a conversation before it’s worth another month of ad spend.
Want a second pair of eyes on your own numbers? Get in touch.